By Michael J. Smith on Thursday June 18, 2009 12:37 PM
Wonderful chart below -- click on it to see full size:
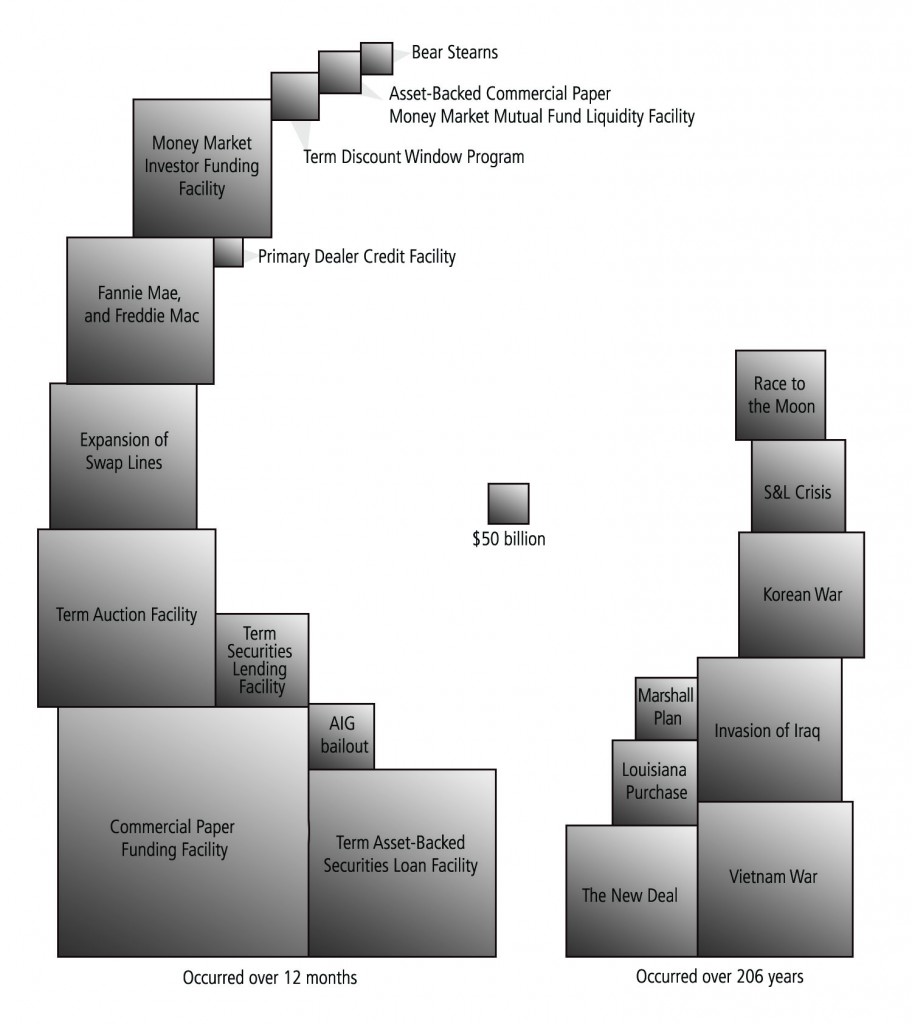
Full context here. Comment seems superfluous.

Comments (8)
Stupefyin.
Posted by Michael Dawson | June 18, 2009 3:02 PM
Posted on June 18, 2009 15:02
This is not the most useful way of thinking about gov't expenditure, it should be done in % of GDP. The chart's creator even acknowledges this method.
I re-gonkulated the graphic to show this proportion; I also removed the "over 206 years" and "over 12 months" 'cause that's even sillier - it's not total gov't expenditure over 206 years, just selected (ie in order to show rate of spending proportion you'd have to analyze the time over which each of those expenditures was made, and even that's a little arbitrary), and I added WWII to keep everything in proportion.
I also couldn't figure out how NASA expenditures were calculated, plus it seems like double-counting, what with the moon project being a separate expense (and btw, is that moon race BOTH Soviet and U.S. spending?)
Anyway, you can check it out at:
http://img211.imageshack.us/img211/9626/bailoutnationresponset.jpg
Posted by calvo | June 20, 2009 7:30 AM
Posted on June 20, 2009 07:30
Cool. I see the point of comparing to GDP, but the absolute constant-dollar amounts are of some interest, too, aren't they? We look at a lot of things this way -- wages, house prices.... But ratios are always fun. Re-gonkulation per capita might be fun too.
Posted by MJS | June 20, 2009 2:31 PM
Posted on June 20, 2009 14:31
Wages & house prices are important in relation to a constant - people. One person (or family), one wage, one dwelling.
But gov't expenditure is meaninful relevant to that which is governed, unless you're trying to make that contrast.
Eg expendiitures of the us gov in the last 12 months vs 12 months of crisis spending of the Iriquois nation circa 1800.
Get my drift? It depends what your comparing, and I don't think the author knows what the comparison is. I look at that chart and think "gee, the economy is much bigger than it used to be! Cool!" (As I'm sure the us/iriquois comparison would illustrate)
To finish the comparison, if we were to conduct an effort on the size of ww2 today (which I personally think would be justified), we would have to spend over 20 trillion dollars. Now that's what I call social spending!
Posted by calvo | June 22, 2009 12:28 PM
Posted on June 22, 2009 12:28
i'll see your 20 trillion
and raise you by taxing
let's tax
the top twenty trillion
of personal wealth holdings
at a rate to service the entire federal debt
look up ricardian equivalence
here's the revenge on that brown nosing
trickster barro
by barro's own means no less
http://en.wikipedia.org/wiki/Ricardian_equivalence
Posted by op | June 22, 2009 2:26 PM
Posted on June 22, 2009 14:26
(Population doesn't have to be adjusted for inflation, even though the individuals who comprise it seem to be steadily inflating.)
"The economy" doesn't consist of dollars interacting, it consists of people interacting, right? And each such person has, on average, a certain number of dollars to spend on lovely things like wars and bank bailouts.
No idea what the outcome would be, but I take calvo's point that ratios are more interesting comparanda than absolute numbers. Just suggesting a different denominator than GDP, which has always had a strangely abstract feel to me.
Good thing I never took an economics course. I would certainly have flunked it.
Posted by MJS | June 22, 2009 8:14 PM
Posted on June 22, 2009 20:14
Per capita definately does show something more interesting - sorry not to acknowledge that point, I mis-read it the first time through.
But still, unless we view the advances of technology as wholly illusory, the key reference point for defecit spending is GPD.
Yes, people relate to people, but under prevailing conditions.
A per capita governmental debt calculation, without some index of productivity, suggests comparison to personal or family savings, leading working people to try to "fix" society's shortfalls with only their paltry earnings, leaving as invisible the great windfall of their productivity, which is siezed in the form of profit.
Much better to compare these expenditures to gross profits (but of course these statistics are not reliably available).
Posted by calvo | June 23, 2009 10:05 AM
Posted on June 23, 2009 10:05
Hmmm. But if advancing technology is the basis for using GDP as the denominator, then... wouldn't you expect a constant-size war to be cheaper in absolute constant dollars rather than more expensive? I mean, a hundred bill in constant dollars oughta buy you a lot more war these days than it did in 1942, right?
Of course technology doesn't help you with bank bailouts and the like -- they never seem to get any cheaper. But presumably the scale of bailout needed (or thought to be needed) is commensurate with the scale of failure, and that in turn is related to the size of the economy. In that case the GDP denominator makes intuitive sense to me, though for reasons not related to technology.
And of course it makes sense to compare deficit spending to GDP. But the original item wasn't talking about deficit spending -- just about spending, period: how much we've historically spent on various things -- right?
Posted by MJS | June 23, 2009 11:23 AM
Posted on June 23, 2009 11:23