A little while back, Owen asked me to do an exposition of Wynne Godley's economic model. Here's a start at least. I'm going to begin with the basics of macro, like GDP, and then move into a simplified sectoral balances approach used to analyze the factors that influence GDP. It's pretty "wonkish", but if you can get through this, then you'll be dismalizing with the big dogs in no time. If anyone has any questions, I'd be happy to answer them.
Gross Domestic Product (GDP) is the value of all goods and services sold within a country during one year. GDP measures a flow rather than a stock (example: the federal deficit is a flow, the federal debt is a stock).
In the above diagram, Nominal GDP would be measured as the flow of money that passes through the "Domestic Producers" in one year, while Real GDP would measure the volume of goods and services produced by the "Domestic Producers" in exchange for that money.
If RGDP increases, then you have growth. If RGDP decreases, then you are in a recession.
If NGDP increases faster than RGDP, then this contributes an increase to the price level (average per unit price of domestically produced and imported goods & services). If the overall change in the price level is positive, then you have inflation.
If NGDP decreases faster than RGDP, then this contributes a decrease to the price level (average per unit price of domestically produced and imported goods & services). If the overall change in the price level is negative, then you have deflation.
The blue arrows (Savings, Taxes and Imports) denote money being taken out of the national economy. The green arrows (Investment, Government Spending and Exports) put money back into the national economy. If the total outflows are more than the total inflows, then NGDP decreases. If total outflows are less than total inflows, then NGDP increases.
(Inflows) - (Outflows) = Change in NGDP
(I + G + X) - (S + T + M) = ΔNGDP
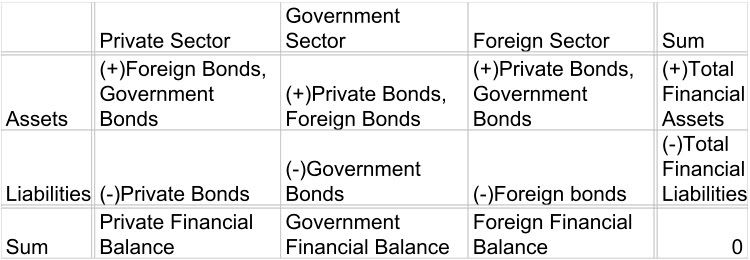
The sectoral balances approach, pioneered by Wynne Godley and now in use at Goldman Sachs and PIMCO, provides a useful way for thinking about the imbalances that may occur. It groups the inflows and outflows according to sector. If any sector takes more money out of the economy than it puts back in (saving), and is not compensated for by the other sectors putting more money in than they take out (dissaving), then the overall flow of money to the Domestic Producers, NGDP, decreases (Paradox of Thrift). For any given period, ex ante, it would look like this:
(I-S) + (G-T) + (X-M) = ΔNGDP
I = Investment
S= Savings
G= Government Spending
T= Taxes
X= Exports
M= Imports
ΔNGDP= Change in Nominal GDP.
The brackets are used to denote the separate sectors.
Private sector (business sector & household sector) dissaving= (I-S)
Public sector dissaving= (G-T)
Foreign sector dissaving= (X-M)
This chart from Goldman Sachs shows the savings rate for each of these three sectors over the last few decades. Whenever a sector stays above 0, it is saving (lending to others). Whenever a sector is below 0 it is dissaving (borrowing from others) . Note that since savings equal debts at the aggregate level, all three rates sum to 0, ex post.
Clinton Era (1992-2000): The trade deficit results in the foreign sector saving. The government also saves by reducing its deficit and eventually establishing a fiscal surplus. The private sector picks up the slack by increasing its borrowing, encouraged by Greenspan's low interest rates. Trend: private dissaving, public saving, foreign saving
Bush Era (2000-2008): The trade deficit is still widening, and the foreign sector is saving even more (Bernanke's "savings glut"). The drag from the trade deficit is so bad that Bush's large fiscal deficits and Greenspan's low interest rates are necessary to keep the economy afloat. Trend: private dissaving, public dissaving, foreign saving
Obama Era (2008-2010): The trade deficit is still an issue, but now the private savings rate has gone up while private borrowing has collapsed. The private sector can't be convinced to increase its borrowing, even with interest rates at 0%. Now the public sector has to pick up the slack for two sectors, necessitating huge deficits. Trend: private saving, public dissaving, foreign saving.
That's it for now. For further reading, you can check out this article.
*NOTE*
Causation: This model itself doesn't say anything about causation (why one sector is saving or dissaving). It leaves that question open. I've hinted at the way that I see the causation running in my summary of the Clinton-Bush-Obama timeline, but the model itself leaves those questions open to further inquiry.